Unit 2.1 - Market and Revenue Curves
Concept of Market & Market Structure
'Market' refers to the existence of direct or indirect
contact between the seller and buyers for buying and selling of a commodity at
a given price.
'Market Structure' refers to the selling environment in which a firm produces & sells its products. It is basically defined by following features: number of buyer and seller of the product, type of the product bought (product differential) & sold, degree of mobility of resources, market information, market entry conditions and the extent to which the actions of firm will affect another firm.
Meaning
and Characteristics of Perfect Competition Market
Meaning/Introduction
of PCM
This market is characterized by complete absence of
rivalry among the individual firms & there is a perfect degree of
competition & single price prevails. Hypothetical market structure &
firms are incapable of influencing the market price either by acting singly or
in a group. e. g. digital marketplace, such as ebays, alibaba.com, amazon.com
etc.
Perfect competition refers to the market structure in
which there are many utility-maximizing buyers & profit-maximizing sellers
of a homogeneous good or service in which there is perfect mobility of factors
of production & both buyers, sellers have perfect information about market
conditions and entry into & exit from the industry is very easy.
Features (Conditions)
- Many buyers & sellers exist that no one
can influence the price, which is determined by collective effort of all the
buyers & sellers.
- Homogeneous or perfectly standardized
commodity
& perfect substitute from the buyer's point of view. So, the sellers do not
spend on advertisement & publicity.
- Free entry & exit (no barriers): profit → new firm
attract & loss → firm leave the industry
- Existing buyer – purchase ↑ or ↓, new can also enter & offer to buy
- Perfect mobility of factors of production: Free to move from
one firm to another throughout the economy for high wage
- Complete market information: to the buyers
& sellers regarding condition of market i.e. price of the product, nature
of product, product cost, wage rate. Advertisement & selling methods do not
have an effect on consumer behavior.
- Sole objective of profit maximization
- Economic rationality: Every buyer &
seller is motivated by his own economic interest in his decision to buy &
sell
- No transportation cost: single uniform
price of the product (firms are supposed to equally far from the market)
- No government regulation: in the form of
tariffs subsidies
- Firms are price takers
- Horizontal sloping demand curve
- Independence of decision making: none of them are
committed to anyone. (buyers – free to purchase, sellers – free to sell)
- Firm & industry concept
Meaning
and Characteristics of Perfect Competition Market
Meaning /
Introduction of Monopoly
The term 'monopoly' is derived from Greek words 'mono'
which means 'single' and 'poly' which means 'seller'. So, monopoly is an
extreme imperfect market structure, where there is only a single seller
(individual, partnership or joint stock) producing a product or serves the
market having no close substitutes. Such a single seller or firm in market is
called monopolist.
In this market, there is barrier to entry and firm is
price maker. It means monopolist has full control over supply and monopolist
does not have interdependence with other competitors. So, he can generate high
profit either by increase in price or high number of sales.
Sources of Monopoly
- Legal Restrictions: For e.g. Cafeteria
in a hospital compound, licensing to a single cable television supplier.
- Patents: Patent right
privilege granted to an inventor and for a specified period of time prohibits
anyone else from producing or using that invention without the permission of
the holder of the patent. For e.g. pharmaceutical companies for medicine they
discover.
- Control of a Scarce Resources or Input: For e.g. South
African DeBeers Diamond Organization.
- Deliberately Created Entry Barriers: Costly court cases
against new rivals on false and deliberately invented charges, excessive
amounts on advertising.
- Market Franchise: License or
permission by a government in a particular area.
- Large Sunk Costs: Huge investment
and long payback period. For e.g. Boeing corporation of US and Airbus of Europe
- Technical Superiority: Technological
expertise or technological brainpower of IBM corporation of US creates monopoly
for many years and nowadays MS corporation for operating system (MS-DOS and
Windows), office packages (MS Office) and other utility software.
- Economies of Scale: Very low AC of
production
- Tariff Barrier: Heavy duty on
imported goods to protect domestic firm or market from foreign competition may
create monopoly.
Difference between Various Markets

Features of Monopoly
- Sole Supplier of the product
serves the large number of buyers and monopolist is regarded as 'a king without
crown'.
- No Close Substitutes: No other firm
produces the same commodity i.e. 𝛴XY = 0. For e.g.
NOC, NEA in case of Nepal.
- Barriers to Entry: Legal (patent, copy
right) or natural restriction, artificial, economic or institutional barriers
(control over essential inputs, economies of scale)
- No Distinction between Firm &
Industry: Firm
is itself an industry
- Independent Price Policy: Price maker
- Possibility of Price Discrimination
- Profit Maximization Objective: Either by
increasing price or sale [TR↑ = P↑×Q↓ or TR↑ = Q↑×P↓]
- Negative Sloped Demand Curve
- Imperfect Dissemination of Information: Imperfect
knowledge about market
- Control Over Supply
- Monopoly Cases are Found in LDCS not in DCS
Concept of Revenue
For a firm or company revenue is the total amount of
money received or acquired by company or firm from goods sold and service
provided once it has paid indirect tax, such as VAT during a certain time
period. It also includes all net sales, exchange of assets; interest and any
other increase in owner's equity and is calculated before any expenses are
subtracted.
In the case of government, revenue is the money
received from taxation, fees, fines, inter-governmental grants or transfers,
securities sales, mineral rights and resource rights, as well as any sales that
are made.
Revenue provides the income which a firm needs to enable it to cover
its costs of production (expenses), and from which it can derive a profit (B = TR – TC). So, revenue (top line or gross income) of a firm is
important for the determination of profit (net income) and that profit can be
distributed to the owners, or shareholders, or retained in the business to
purchase new capital assets or upgrade the firm’s technology.
Concepts of Total, Average and Marginal
Revenues
Total Revenue (TR)
TR is the total earning of a firm by selling certain (given) amounts of its products at a price. If a firm sells 100 units of output at a price of Rs. 10, total revenue will be Rs. 1000 (Rs.10×100). It is obtained by multiplying per-unit price of the commodity by the quantities of the commodity sold.
It is expressed as: TR =
P×Q
Where P = price per unit and Q = quantity sold.
Similarly, TR = MR1 + MR2 + ……+ MRn
The revenue is important to the analysis a firm's
short-run production decision to maximize profit.
Average Revenue (AR)
AR is the revenue per unit of output sold. It is also called average receipt from the sale of certain quantities of a commodity. It is obtained by dividing the total revenue by the quantities sold. If Rs. 1000 is received from the sale of 100 units of a commodity, then AR is equal to Rs. 10. It is expressed as:
AR = TR/Q = (P×Q)/Q = P
AR in fact is the price of the commodity at each level
of output. Therefore, it can be written that AR = P. If the price is constant,
then AR is also constant; but if price changes with respect to quantity, then
AR is also variable.
The AR curve of a firm is the demand curve of a
consumer because price paid by a consumer is the revenue received by a firm
which shows the different quantity transected at different prices.
Marginal Revenue (MR)
MR is the addition to the total revenue as a result of
one unit increase in the sale. In other words, it is an increase in total
revenue resulting from an increase in the level of output by one unit. It is
expressed as:
MR = ΔTR/
or, MRn = TRn – TRn-1
(MR is derived by subtracting the TR from first unit of output from the second
unit of output)
For example, if TR from 10 units of output sold is Rs. 200 and from 11 units sold is Rs. 220, the MR will be Rs. (=220-200).
Derivation
of TR, AR & MR Curve Under PCM & Monopoly
Derivation of TR, AR & MR Curve Under
PCM
PCM is a market structure with a large number of small
firms, each selling identical goods. Perfectly competitive firms have perfect
knowledge and perfect mobility into and out (free entry into and free exit) of
the market. These conditions mean perfectly competitive firms are price taker,
they have no market control and receive the going market price for all output
sold. Different units of the commodities are sold at the same price. When
different units are sold at the same price AR will be equal to MR.
Under PCM price is determined by market forces viz.
demand and supply. The price is beyond the control of a firm. The AR or price
thus remains constant. As a result, the demand curve of a firm becomes
perfectly elastic to output and perfectly inelastic to the price.
If different units are sold at same price, MR equals
to AR (price). With the additional sale, TR increases at the rate of price.
Illustration
|
Units
of Sale |
P
or AR |
Total
Revenue (P×Q) |
MR |
|
0 |
10 |
0 |
- |
|
1 |
10 |
10 |
10 |
|
2 |
10 |
20 |
10 |
|
3 |
10 |
30 |
10 |
|
4 |
10 |
40 |
10 |
|
5 |
10 |
50 |
10 |
As shown in the table, the price is constant at Rs. 10 for all units. Hence, the AR is also constant at Rs. 10. The TR is increasing at constant rate with increase in units of sale. It goes on increasing by Rs. 10 with every increase in units of sale. MR is the change in TR. Therefore, MR is constant at Rs. 10.
Hence, AR and MR are equal and constant at every unit.
The TR, AR and MR curve can be derived from above illustration.

In figure, TR is the TR curves. It slopes upward at a constant rate with the increase in quantity of sales. So, TR curve slopes upward in a uniform manner. AR and MR are AR & MR curve respectively. The MR curve coincided with AR curve because they are equal. AR and MR curve is parallel to x-axis which shows that price is constant even if the quantity sold increases.
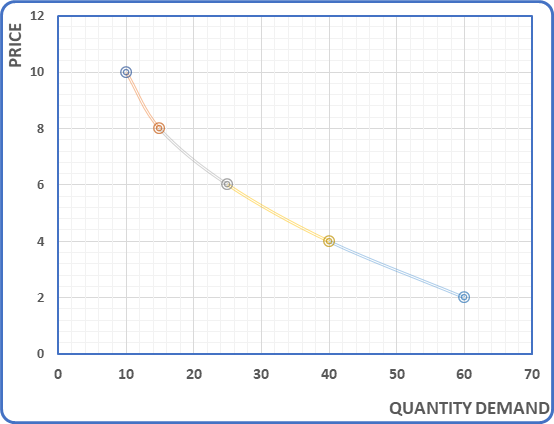
Derivation of TR, AR & MR Curve Under Monopoly
A market in which one or more basic features of the
market of perfect competition are not found is known as an imperfect
competition (e.g. monopoly, monopolistic competition, and oligopoly). Under
imperfect competition, a firm can increase sale by reducing the price of the
commodity. It implies that the firm faces a downward sloping AR or demand
curve. When AR curve slopes downwards, MR curve will also slope downward and it
lies below the AR curve.
In monopoly, there is a single seller, as a single
seller, it has control over price or supply of the product like other producer,
profit maximization is the main objective of monopoly firm. It can maximize
profit, by maximizing sale of by fixing higher price. But generally, monopoly
list lowers his price to maximize sale and profit, AR decreases along with
decrease in price (because in general AR = P). When additional units are sold
at lower price, MR declines. But MR decreases faster than AR. TR of the
monopolist increases at first, reaches its maximum point. After that, if price
is decreased more to sale additional units, TR falls.
The relationship between TR, AR and MR under monopoly
can be illustrated by the help of following table:
|
Units
of Sale |
P
or AR |
TR
(P×Q) |
MR |
|
0 |
11 |
0 |
- |
|
1 |
10 |
10 |
10 |
|
2 |
9 |
18 |
8 |
|
3 |
8 |
24 |
6 |
|
4 |
7 |
28 |
4 |
|
5 |
6 |
30 |
2 |
|
6 |
5 |
30 |
0 |
|
7 |
4 |
28 |
-2 |
The table shows that a monopolist prefers to lower the
price of his commodity to sell larger quantity. When a monopolist does so, AR
(P) starts to fall. TR increases but at decreasing rate along with additional
unit of sale. Therefore, MR is declining. But the rate of fall in MR is higher
than the rate of fall in AR. At 6th unit, TR is maximum where MR is
zero. After this unit, if price is reduced to sell more units, TR starts to
decline. Therefore, MR becomes negative but AR remains positive. The relation
between AR, TR and MR is represented in the figure below.

In figure, TR is rising along with additional unit of
sale. It becomes maximum at point 6 unit of sale, where MR is zero. MR and AR
both are downward sloping. But MR curve is declining faster than AR curve.
Therefore, MR curve lies between AR curve. MR becomes zero when it touches
X-axis at 6 unit of sale. Beyond this point MR curve below X-axis below
negative but AR remains positive.
Relationship between TR and MR
- As long MR is positive, TR curve is increasing.
- Whenever TR is maximum, MR is zero.
- When TR curve starts to fall (MR) curve falls below X-axis i.e., MR becomes negative.

Comments
Post a Comment
If you have any doubt, Please let me know !